Announced its results for the 13 weeks ended July 30, 2022 (“second quarter Fiscal 2023”).
“Signet’s focus on gaining market share, driving further operating efficiencies, and building capabilities that are true competitive advantages, is putting us in a position to deliver long-term growth and increase shareholder value,” said Virginia C. Drosos, Chief Executive Officer. “Our results demonstrate the continued agility of our Signet team, the strength of our differentiated banner portfolio, and the flexibility of our operating model. This is all underpinned by a balance sheet that enables us to continue to make strategic investments such as our recent acquisition of Blue Nile.”
“The discipline of our Signet team delivered $1.8 billion in revenue and a 10.6% operating margin, despite a softer topline environment,” said Joan Hilson, Chief Financial and Strategy Officer. “Our working capital efficiency reflects inventory levels down year over year, excluding acquisitions. This gives us the confidence that we are well positioned to deliver newness with minimal levels of clearance for the Holidays.”
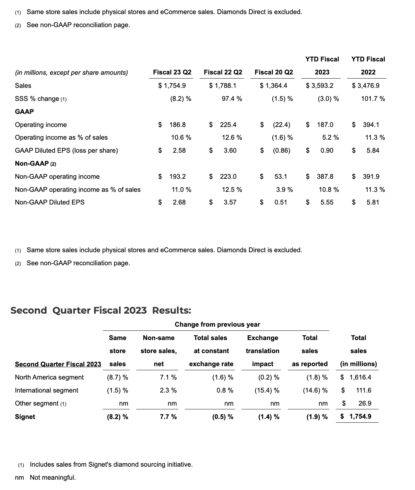
- Total sales were $1.8 billion, down $33.2 million or 1.9% to a record Q2 of FY22, and up 29% vs. Q2 of FY20.
- Same store sales (“SSS”) down 8.2% (1) to Q2 of FY22.
- GAAP operating income of $186.8 million, down from $225.4 million in Q2 of FY22, including $6.4 million related to the fair value adjustment of acquired inventory as well as acquisition-related charges.
- Non-GAAP operating income(2) of $193.2 million, down from $223.0 million in Q2 of FY22 and up from $53.1 million in Q2 of FY20.
- GAAP diluted earnings per share (“EPS”) of $2.58, down from diluted EPS of $3.60 in Q2 of FY22, including $0.09 in charges relating to the fair value adjustment of acquired inventory as well as acquisition-related charges.
- Non-GAAP diluted EPS(2) of $2.68, down from $3.57 in Q2 of FY22.
- Cash and cash equivalents, at quarter end, of $851.7 million, down approximately $722 million to Q2 of FY22 reflecting share repurchases and inventory in-stock replenishment, as well as the acquisition of Diamonds Direct in the prior year.
- Year to date cash used for operating activities of $114.9 million, down approximately $573 million to Q2 of FY22 and driven by inventory in-stock replenishment.
- Completed $22.8 million of share repurchases during the second quarter.

By reportable segment:
North America
- Total sales of $1.6 billion, down 1.8% to Q2 of FY22.
- SSS declined 8.7% to Q2 of FY22 reflecting higher average transaction value (“ATV”) but a lower number of transactions.
International
- Total sales of $111.6 million, down 14.6% to Q2 of FY22.
- SSS declined 1.5% versus Q2 of FY22 reflecting higher ATV but a lower number of transactions.
GAAP gross margin was $664.7 million, or 37.9% of sales, down 220 basis points to the second quarter last year. This reflects occupancy cost deleverage on lower sales and the strength of Diamonds Direct’s bridal business which carries a lower relative margin, while organic banners had similar merchandise margins to last year. Additionally, the lower rate is a result of technology investments and absence of the COVID-related tax abatements within Signet’s UK operations.
SG&A was $477.3 million, or 27.2% of sales, an improvement of 90 basis points to the second quarter last year. This improvement reflects the impact of lower payroll-related costs, enhanced credit agreements finalized in Fiscal 2022, and the efficiency of Diamonds Direct’s operating model, partially offset by labor and technology investments.
GAAP and non-GAAP operating income in the prior year second quarter included other income of $9.0 million related to UK government grants as well as interest income from the Company’s credit card program, which was sold in the second quarter of Fiscal 2022.
GAAP operating income was $186.8 million or 10.6% of sales, compared to $225.4 million, or 12.6% of sales in the prior year second quarter.
Non-GAAP operating income was $193.2 million, or 11.0% of sales, compared to $223.0 million, or 12.5% of sales in prior year second quarter. Non-GAAP operating income excluded $6.4 million in charges relating to the fair value adjustment of acquired inventory and acquisition-related charges.


